Scalability Report
The itwinai Scalability Report provides insights into how well your model’s performance
scales when training across multiple GPUs and nodes. It can be used to find bottlenecks or bugs
as you distribute your workload, as well as help you monitor your model’s sustainability. The
main goals are as follows:
Understand how well your model scales with regards to the given metrics
Discover which distribution strategy works best for your pipeline
The Scalability Report includes the following metrics:
Average time per epoch
Relative speedup of time per epoch
GPU Utilization (0-100%)
GPU Power Consumption (watt-hours)
Computation vs. other
For more information about profiling with itwinai, you can have a look at the
profiling overview.
Note
To use the Scalability Report functionality of itwinai, you need to use a Trainer object
that inherits the itwinai TorchTrainer.
Generating the Data
To generate the data, you have to train a model with the various profilers enabled, which can be toggled using the following flags in your training configuration:
steps:
 - ...
 - _target_: <your-trainer-class>
   measure_gpu_data: True  # Measures GPU utilization and power consumption
   enable_torch_profiling: True  # Enable profiling for comparing comm. time vs. other
   store_torch_profiling_traces: True # Store the traces from the profiling (requires setting enable_torch_profiler to True)
   measure_epoch_time: True  # Measures avg. epoch time and rel. speedup
   ...
The epoch time is measured using the EpochTimeTracker, while the remaining metrics are measured using the following decorators:
PyTorch Profiler: This profiler measures the time spent in computation vs. other operations in your distributed machine learning. This is done by comparing the time spent in PyTorch’s ATen—i.e. computation—with any other operations. It uses the PyTorch Profiler to retrieve this information and is enabled using the
enable_torch_profilingflag.GPU Data Profiler: This profiler measures the GPU utilization and the total power consumption of the training. This is done by probing the GPU at a pre-defined interval and retrieving the needed data. The data from the GPU data profiler is saved to MLFlow and therefore not a part of the generate-scalability-report command.
If you overwrite the TorchTrainer’s train() method, then the decorators need to
be placed above your overwritten train() method as in the following example:
from itwinai.torch.monitoring.monitoring import measure_gpu_utilization
from itwinai.torch.profiling.profiler import profile_torch_trainer

class MyTrainer(TorchTrainer):
   ...

   @profile_torch_trainer
   @measure_gpu_utilization
   def train(self, ...):
      # Your train method here
If your profilers are enabled in the configuration—and if applicable, your decorators have been
appropriately positioned above your train() method—then this will create a directory named
scalability-metrics in the current working directory, under which three subdirectories will
be created:
epoch-time: The wall-clock time data from theEpochTimeTrackercomputation-data: The computation overhead data
The GPU data will be written to MLFlow.
Generating the Report
You can generate the report using the following command:
itwinai generate-scalability-report
This command takes in some extra arguments that can be viewed with the --help flag:
itwinai generate-scalability-report --help
When running this command by default, it will look in your scalability-metrics directory
and look for the subdirectories listed above. Only the reports relevant to the subdirectories
that are present will be created, while missing subdirectories will only result in a warning.
Example Results
The following will show some examples of scalability reports. In particular, it will show results from the MNIST plugin and from the Virgo use case. The Virgo use case scales fairly well, while the MNIST case does not, and this is reflected in the plots.
The reason for the poor scaling of the MNIST use case is likely that the dataset is quite small, resulting in the overhead of distribution taking up a significant portion of the final training time. The report results in a table of scalability results—printed in the console—as well as plots showing the same results visually. An example of the resulting console output can be seen here.
MNIST
######## Epoch Time Report ########
name workers avg_epoch_time
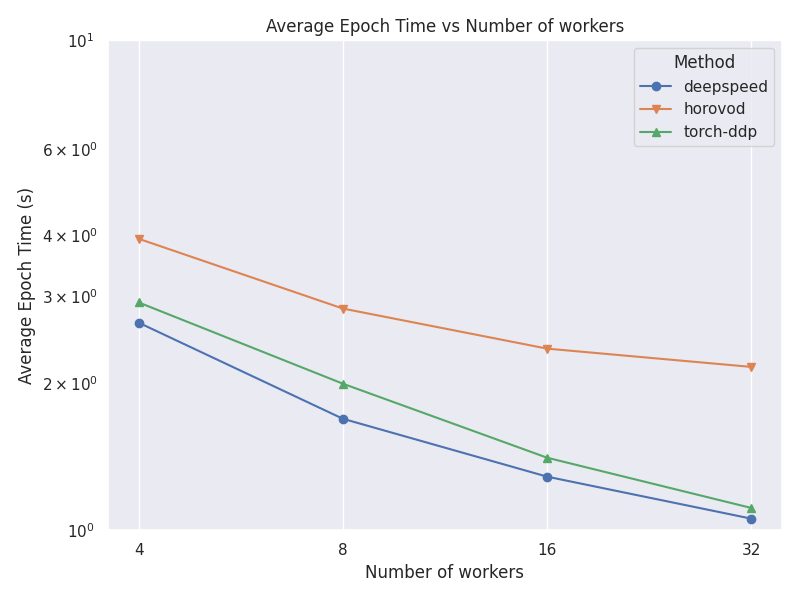
deepspeed 4 2.65 s
deepspeed 8 1.69 s
deepspeed 16 1.29 s
deepspeed 32 1.06 s
horovod 4 3.94 s
horovod 8 2.83 s
horovod 16 2.35 s
horovod 32 2.15 s
torch-ddp 4 2.92 s
torch-ddp 8 1.99 s
torch-ddp 16 1.41 s
torch-ddp 32 1.11 s
No GPU Data Found
######## Computation Data Report ########
num_gpus strategy computation_fraction
4 deepspeed 75.47 %
4 horovod 70.05 %
4 torch-ddp 10.67 %
8 deepspeed 30.66 %
8 horovod 55.40 %
8 torch-ddp 5.67 %
16 deepspeed 9.52 %
16 horovod 45.05 %
16 torch-ddp 3.96 %
32 deepspeed 4.80 %
32 horovod 38.94 %
32 torch-ddp 2.49 %
Virgo
######## Epoch Time Report ########
name workers avg_epoch_time
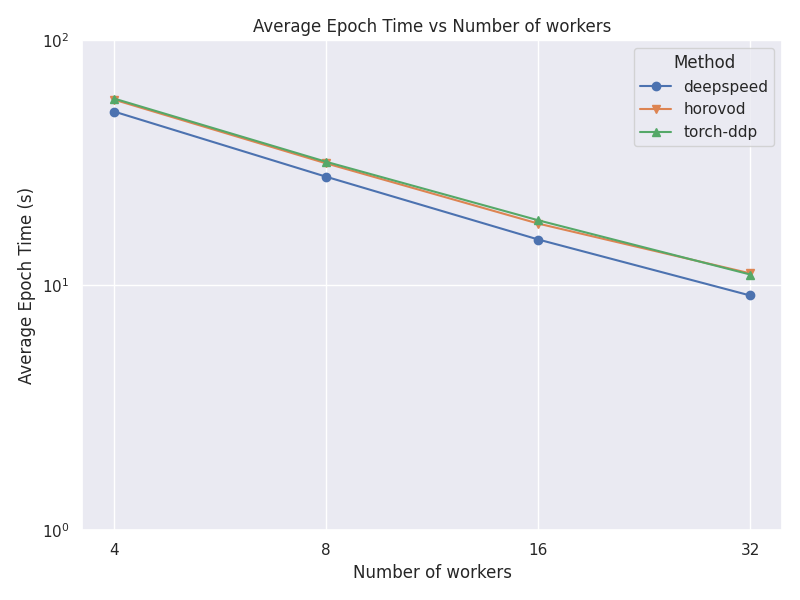
deepspeed 4 51.18 s
deepspeed 8 27.74 s
deepspeed 16 15.38 s
deepspeed 32 9.09 s
horovod 4 57.23 s
horovod 8 31.46 s
horovod 16 17.86 s
horovod 32 11.19 s
torch-ddp 4 57.83 s
torch-ddp 8 31.92 s
torch-ddp 16 18.42 s
torch-ddp 32 11.07 s
No GPU Data Found
######## Computation Data Report ########
num_gpus strategy computation_fraction
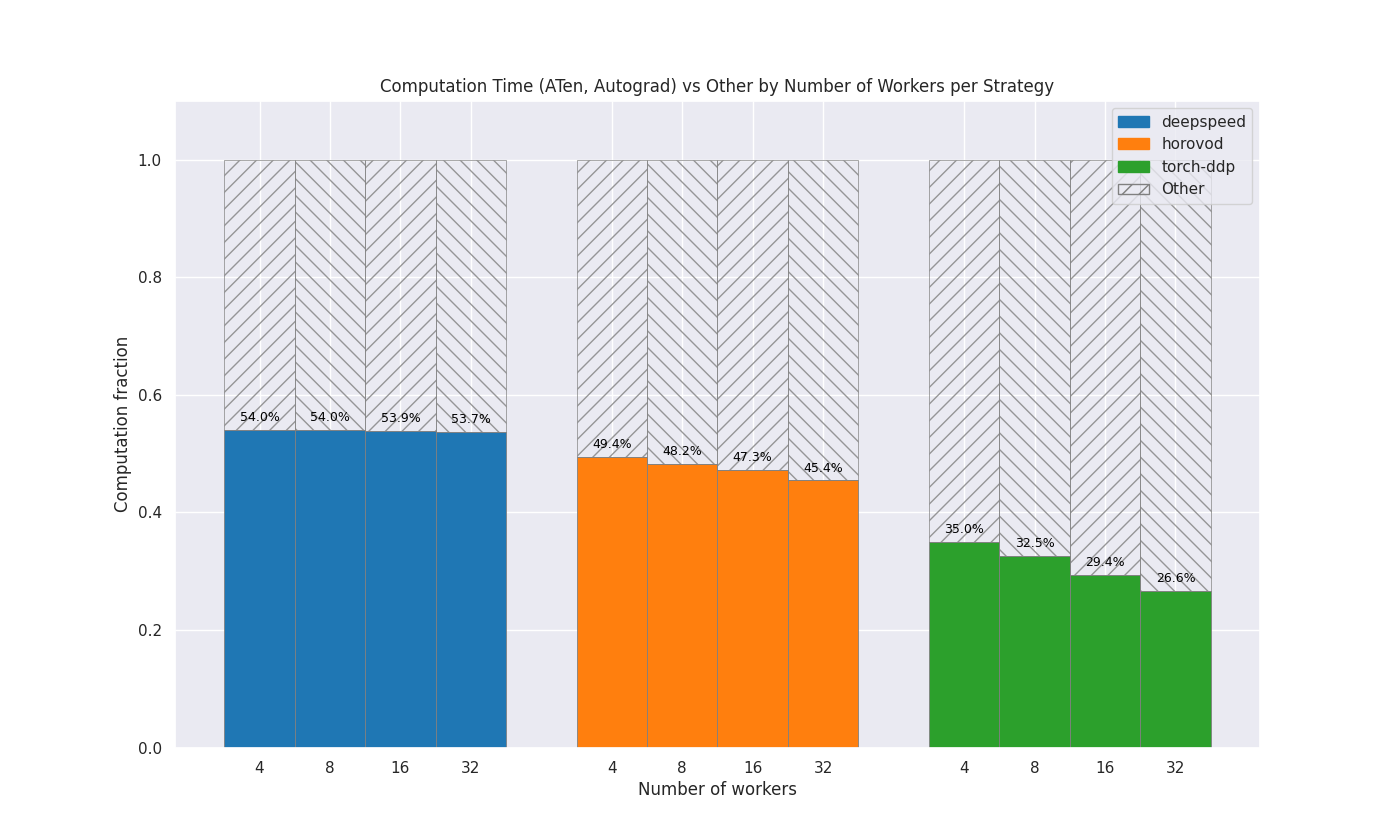
4 deepspeed 54.03 %
4 horovod 49.38 %
4 torch-ddp 35.04 %
8 deepspeed 53.97 %
8 horovod 48.21 %
8 torch-ddp 32.54 %
16 deepspeed 53.88 %
16 horovod 47.26 %
16 torch-ddp 29.44 %
32 deepspeed 53.67 %
32 horovod 45.44 %
32 torch-ddp 26.59 %
In both cases, data was collected for 4, 8, 16 and 32 GPUs for the DeepSpeed, Horovod
and PyTorch DDP strategies. The associated plots can be seen below:
Average Epoch Time Comparison
This plot shows a comparison between the average time per epochs for each strategy and number of nodes.
MNIST Use Case
Virgo Use Case
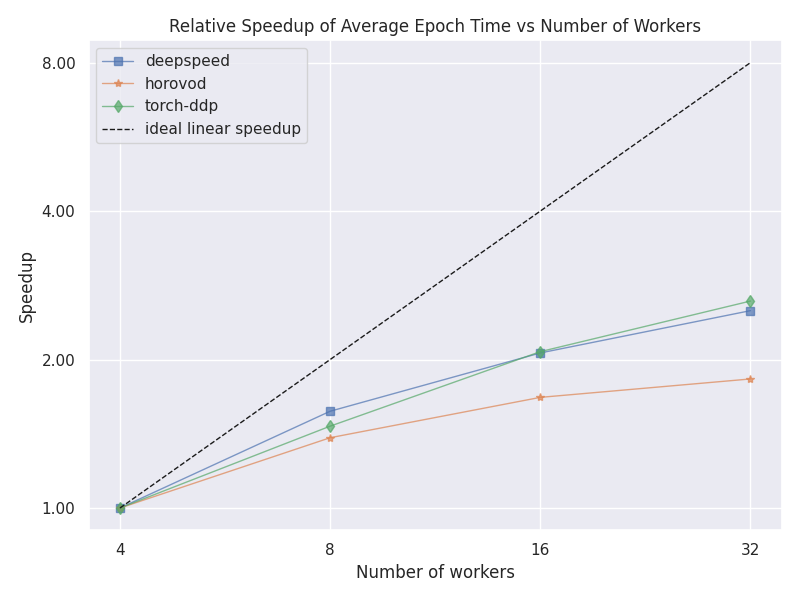
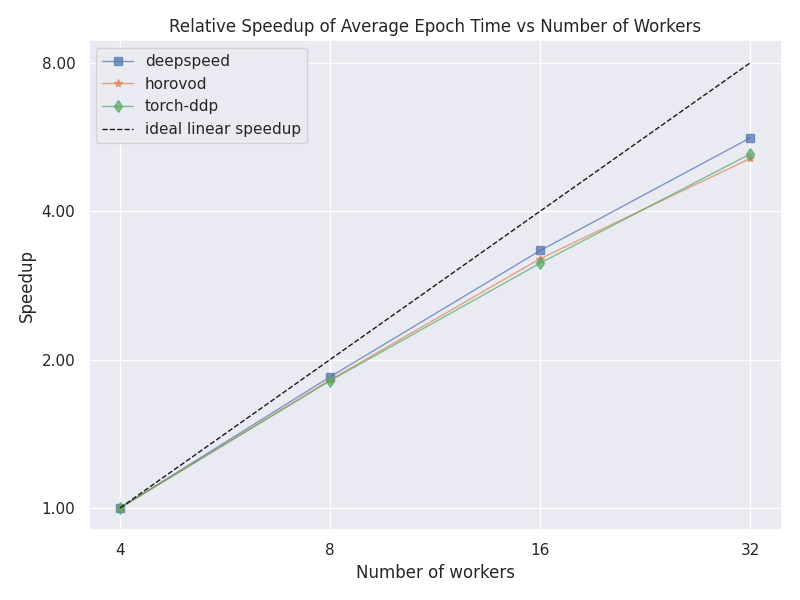
Relative Epoch Time Speedup
This plot shows a comparison between the speedup between the different number of nodes for each strategy. The speedup is calculated using the lowest number of nodes as a baseline.
MNIST Use Case
Virgo Use Case
Computation vs other
This plot shows how much of the GPU time is spent doing computation compared to other operations, for each strategy and number of nodes. The colored area represents computation and the shaded area represents other operations, e.g. communication. For each strategy, the columns are normalized to be between 0.0 and 1.0.
MNIST Use Case
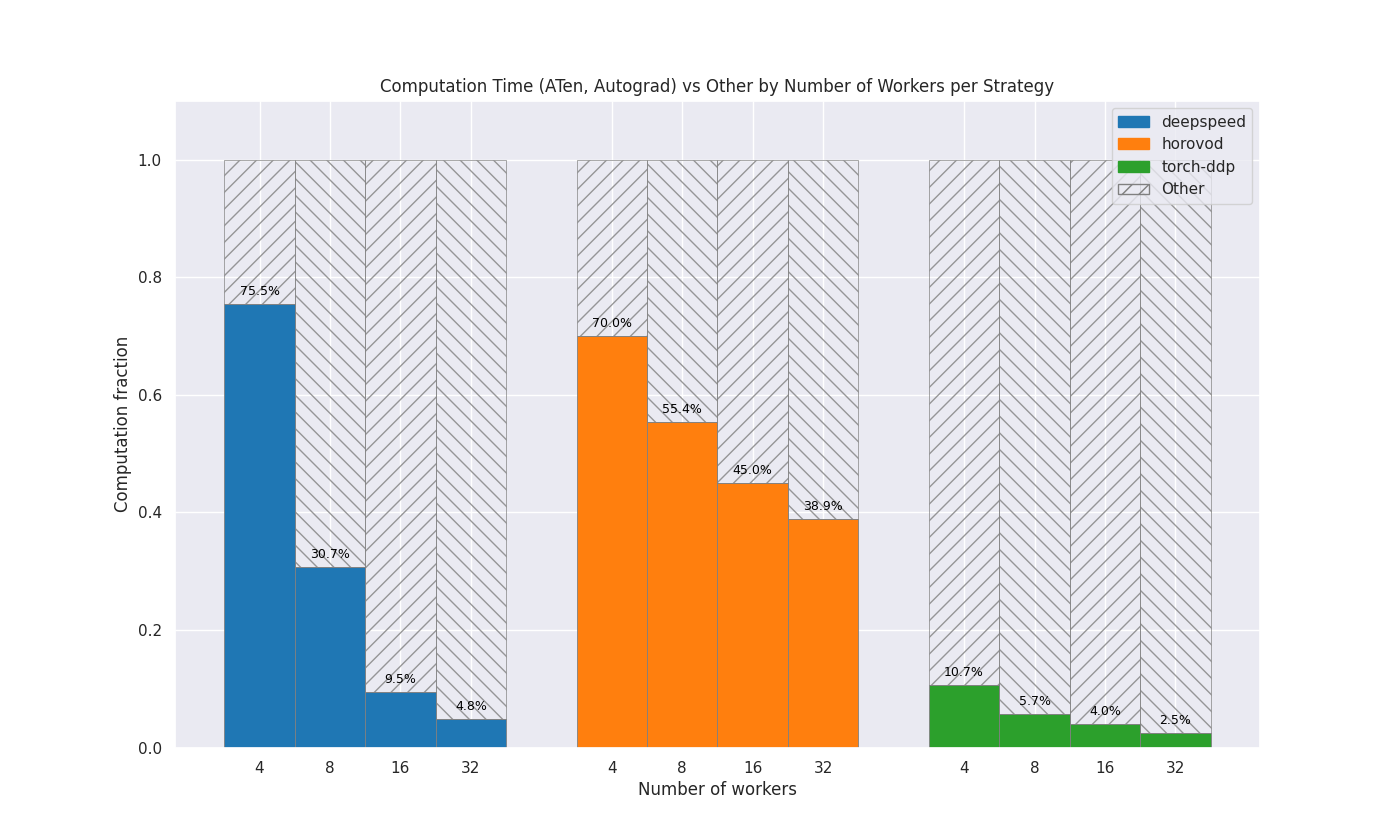
Virgo Use Case