Drought Early Warning in the Alps (EURAC)
You can find the relevant code for the EURAC hython use case on the plugin’s repository page hython-itwinai-plugin, or by consulting the use case’s README:
Integration authors: Jarl Sondre Saether (CERN), Henry Mutegeki (CERN), Iacopo Ferrario (EURAC), Matteo Bunino (CERN), Linus Eickhoff (CERN)
Warning
The code in this folder is no outdated and no longer maintained. Please checkout the plugin’s repository page hython-itwinai-plugin instead.
Installation
First, make sure to install itwinai from this branch! Use the developer installation instructions.
Then install the dependencies specific to this use case by first entering the folder and then installing the dependencies with pip:
cd use-cases/eurac
pip install -r requirements.txt
Training
You can run the RNN pipeline with the following command:
itwinai exec-pipeline +pipe_key=rnn_training_pipeline
If you want to use the Conv pipeline instead, you can replace rnn_training_pipeline
with conv_training_pipeline.
Training using SLURM
If you wish to train the model using SLURM, you can use the itwinai SLURM script
builder with the following command to generate a preview of the script:
itwinai generate-slurm -c slurm_config.yaml --no-save-script --no-submit-job
If you are happy with the SLURM script, you can run it either by removing
--no-submit-job and let the builder submit it for you, or you can remove
--no-save-script—allowing the builder to store the script for you—and then running
the script yourself using sbatch <path/to/script>.
Scaling Tests and “runall”
Scaling tests provide information about how well the different distributed strategies
scale. We have integrated them into this use case and you can run them using the
slurm.py file. The format is very similar to the itwinai generate-slurm command,
and you can even pass it the configuration file, but it will overwrite some of the
parameters automatically—such as std_out, err_out and job_name.
You can run all strategies by setting --mode to runall and you can run scaling
tests by setting --mode to scaling-test and specifying scalability_nodes in the
configuration.
Running HPO for EURAC Non-distributed
Hyperparameter optimization (HPO) is integrated into the pipeline using Ray Tune. This allows you to run multiple trials and fine-tune model parameters efficiently. HPO is configured to run multiple trials in parallel, but run those trials each in a non-distributed way.
To launch an HPO experiment, run
sbatch slurm_ray.sh
This script sets up a Ray cluster and runs hpo.py for hyperparameter tuning.
You may change CLI variables for hpo.py to change parameters,
such as the number of trials you want to run, to change the stopping criteria for the trials or to set a different metric on which ray will evaluate trial results.
By default, trials monitor validation loss, and results are plotted once all trials are completed.
Exporting a local MLFlow run to the EGI cloud MLFlow remote tracking server
Install mlflow-export-import
export MLFLOW_TRACKING_INSECURE_TLS='true'
export MLFLOW_TRACKING_USERNAME='iacopo.ferrario@eurac.edu'
export MLFLOW_TRACKING_PASSWORD='YOUR_PWD'
export MLFLOW_TRACKING_URI='https://mlflow.intertwin.fedcloud.eu/'
Assuming the working directory is the EURAC use case, export the run-id from the local mlflow logs directory. This will also export all the associated artifacts (including models and model weights)
copy-run --run-id 27a81c42c2cb40dfb7505032f1ac1ef5 --experiment-name "drought use case lstm" --src-mlflow-uri mllogs/mlflow --dst-mlflow-uri https://mlflow.intertwin.fedcloud.eu/
Loading a pre-trained model from the mlflow registry on the local host for prediction/fine-tuning
export MLFLOW_TRACKING_INSECURE_TLS='true'
export MLFLOW_TRACKING_USERNAME='iacopo.ferrario@eurac.edu'
export MLFLOW_TRACKING_PASSWORD='YOUR_PWD'
export MLFLOW_TRACKING_URI='https://mlflow.intertwin.fedcloud.eu/'
import mlflow

logged_model = 'runs:/1811bd3835d54585b6376dd97f6687a5/LSTM'

loaded_model = mlflow.pyfunc.load_model(logged_model)
Warning
While the model is loading an error occurs RuntimeError: Default process group has not been initialized, please make sure to call init_process_group. Possible reasons due to package version mismatch https://github.com/mlflow/mlflow/issues/4903.
Scalability Metrics
Warning
The scalability plots in here are outdated, the new plots are similar but are grouped by strategies instead of number of nodes.
Here are some examples of the scalability metrics for this use case:
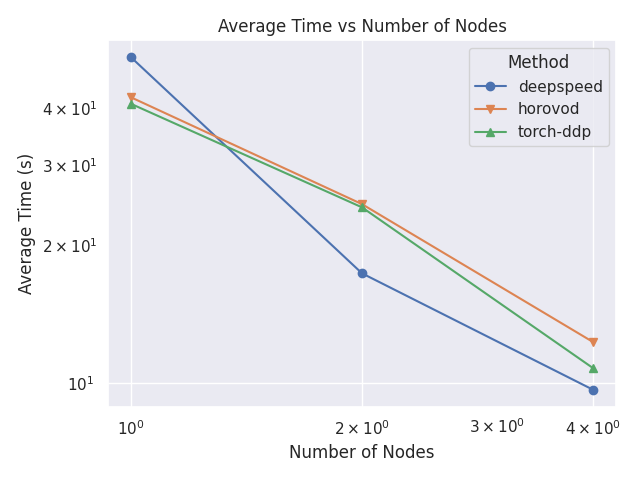
Average Epoch Time Comparison
This plot shows a comparison between the average time per epochs for each strategy and number of nodes.
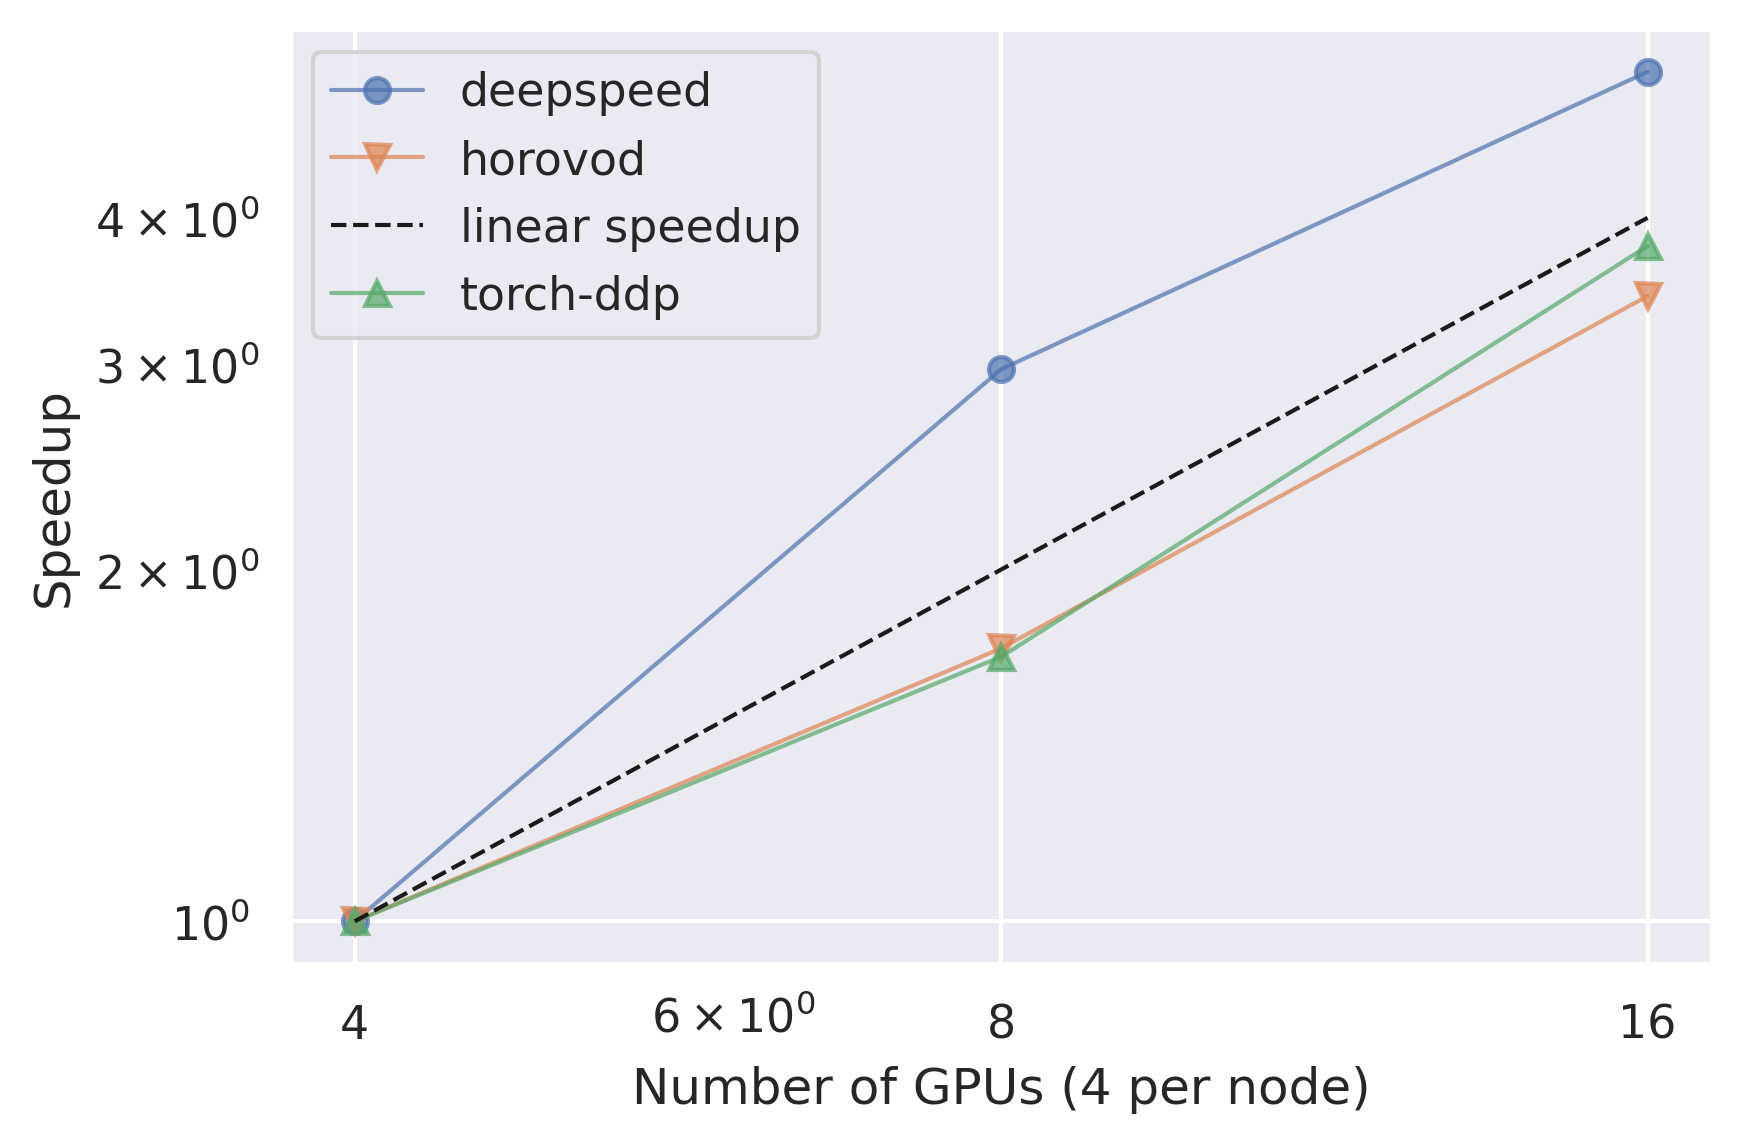
Relative Epoch Time Speedup
This plot shows a comparison between the speedup between the different number of nodes for each strategy. The speedup is calculated using the lowest number of nodes as a baseline.
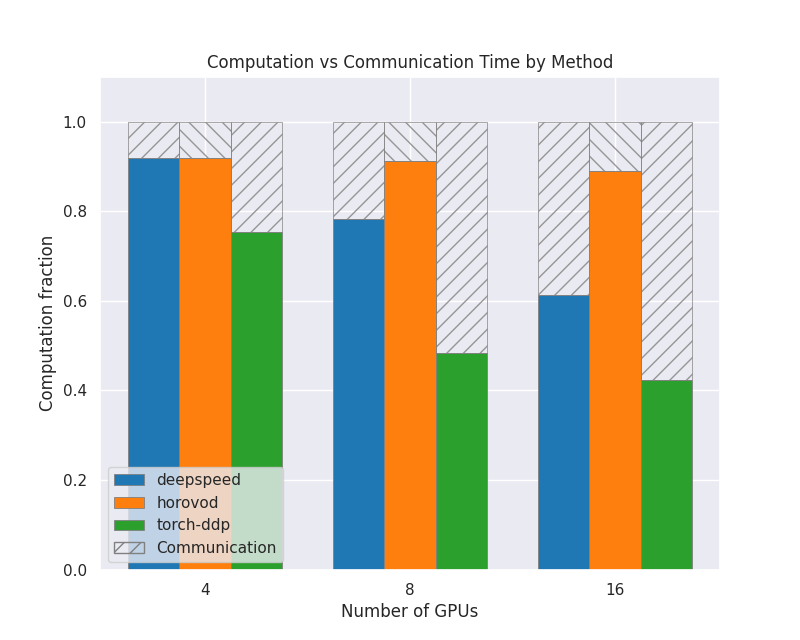
Computation vs Other
This plot shows how much of the GPU time is spent doing computation compared to all the other operations, for each strategy and number of nodes. The shaded area is showing all non-compute operations and the colored area is computation. They have all been normalized so that the values are between 0 and 1.0.
Communication vs Computation
This plot is deprecated and has to be explicitly generated with the –include-communication flag. Computation vs Other is preferred as it is more comparable across different systems. This plot shows how much of the GPU time is spent doing computation compared to communication between GPUs and nodes, for each strategy and number of nodes. The shaded area is communication and the colored area is computation. They have all been normalized so that the values are between 0 and 1.0.
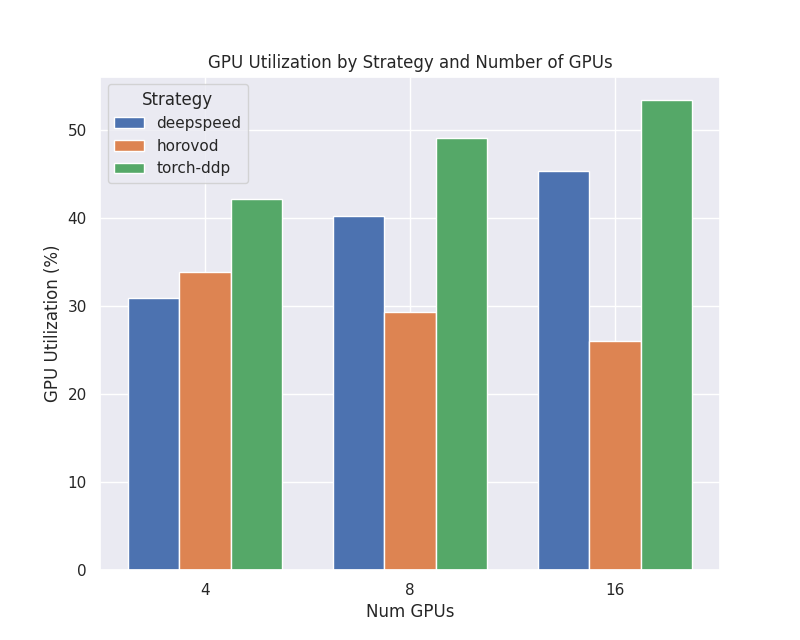
GPU Utilization
This plot shows how high the GPU utilization is for each strategy and number of nodes, as a percentage from 0 to 100. This is the defined as how much of the time is spent in computation mode vs not, and does not directly correlate to FLOPs.
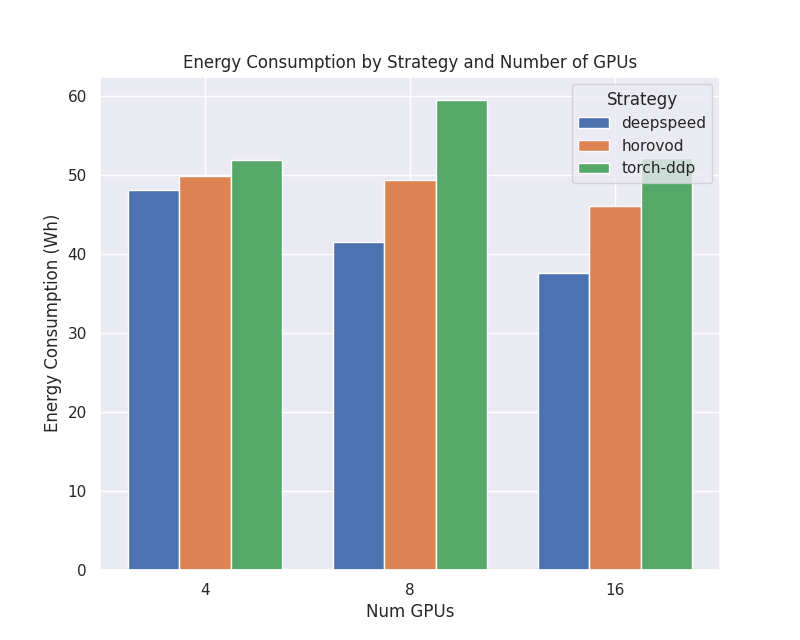
Power Consumption
This plot shows the total energy consumption in watt-hours for the different strategies and number of nodes.